Building overlay networks using tunnels was always done to achieve connectivity between isolated networks that needed to share the same policies, VLANs or security domains. In particular, they represent a strong use-case in the data center, where tunnels are created between the hypervisors in different locations allowing virtual machines to be provisioned independently from the physical network.
In this post I am going to present how to build such tunnels between Open vSwitch bridges running on separate machines, thus creating an overlay virtual Layer 2 network on top of the physical Layer 3 one.
By itself, this article does not bring anything new - there are multiple blogs describing various tunneling protocols. The particularity of this post is that I present multiple encapsulations with packet capture and iperf tests and the fact that, instead of hypervisors and VMs, I am going to use OVS bridges and network namespaces - both of these are extensively used in emerging data center standards and products such as OpenStack or CloudStack.
I encourage you to follow the steps described in this post, perform the same iperf tests (and packet captures, if you want) and share with me the results you've got ! [UPDATE: the iperf tests required some additional tweaking - MTU, TCP Segmentation Offload, etc - so I will present all of those in a separate article]
Before we start I'd like to mention the inspirational articles on this topic from Scott Lowe and Brent Salisbury.
Initial State
This lab is based on the setup explained in this post - up to the point of creating the network namespaces. I am using two virtual machines (VirtualBoxes managed via Vagrant) called 192.168.56.0/24 and 192.168.57.0/24).
The task is to
Overlay Tunnels using Open vSwitch
Now we are going to use Open vSwitch commands to create tunnels between the OVS bridges in order to connect the left and right namespaces at Layer 2. Before you proceed, make sure that you are back in the initial state (by rebooting both vagrant boxes).
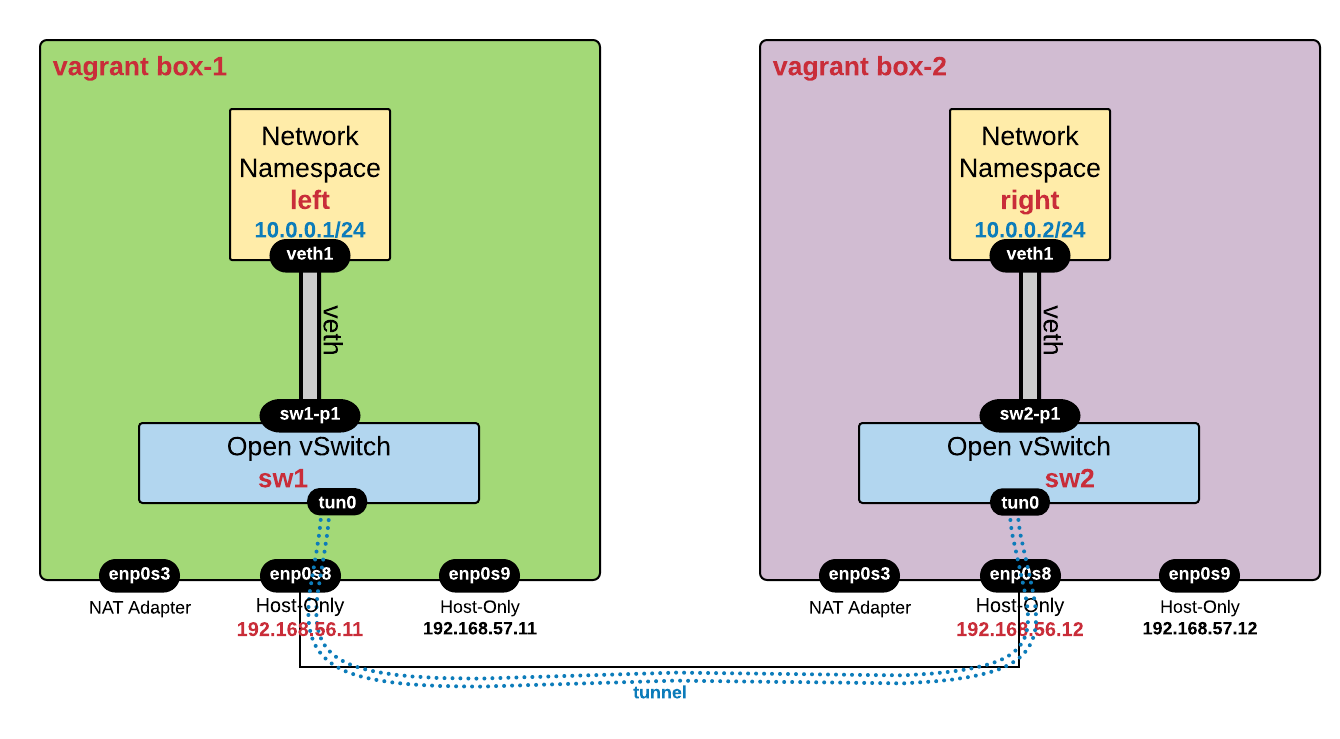
Below is the diagram describing the target connectivity:
Let's create everything except the tunnels - more info about the setup can be found in this post:
# on vagrant box-1 # ----------------- sudo ip netns add left sudo ip link add name veth1 type veth peer name sw1-p1 sudo ip link set dev veth1 netns left sudo ip netns exec left ifconfig veth1 10.0.0.1/24 up sudo ovs-vsctl add-br sw1 sudo ovs-vsctl add-port sw1 sw1-p1 sudo ip link set sw1-p1 up sudo ip link set sw1 up# on vagrant box-2 # ----------------- sudo ip netns add right sudo ip link add name veth1 type veth peer name sw2-p1 sudo ip link set dev veth1 netns right sudo ip netns exec right ifconfig veth1 10.0.0.2/24 up sudo ovs-vsctl add-br sw2 sudo ovs-vsctl add-port sw2 sw2-p1 sudo ip link set sw2-p1 up sudo ip link set sw2 up
GRETAP
First encapsulation that we are going to test is GRETAP, which encapsulates the entire Layer 2 frame into a GRE packet. Note that the Protocol Type in the GRE header is 0x6558 - Transparent Ethernet Bridging - which denotes that the payload is the Ethernet frame, as opposed to 0x0800 used in case of carrying Layer 3 IP packets.
Here are the commands to create the GRE tunnel between the OVS bridges:
# on vagrant box-1
# -----------------
sudo ovs-vsctl add-port sw1 tun0 -- set Interface tun0 type=gre options:remote_ip=192.168.56.12

# on vagrant box-2
# -----------------
sudo ovs-vsctl add-port sw2 tun0 -- set Interface tun0 type=gre options:remote_ip=192.168.56.11


# Test that now there is connectivity between 'left' and 'right'
# ----------------------------------------------------------------
ubuntu@box-1 ~$ sudo ip netns exec left ping 10.0.0.2
PING 10.0.0.2 (10.0.0.2) 56(84) bytes of data.
64 bytes from 10.0.0.2: icmp_seq=1 ttl=64 time=0.644 ms
64 bytes from 10.0.0.2: icmp_seq=2 ttl=64 time=0.436 ms
...
One question you may ask is: how does the tunnel work between OVS switches sw1 and sw2 since the physical interfaces (enp0s8) do not belong to them? It looks like the OVS bridge is not connected to the outside world at all!
The answer is not that obvious, unfortunately.
|
NOTES
|
You can (and should) always use command ovs-vsctl show and ovs-ofctl show <bridge> to check the configuration and status of the bridges and interfaces!
|
root@box-1 ~$ovs-vsctl show 2963c9d3-3069-4edd-88dc-b313da7366de Bridge "sw1"Port "tun0" Interface "tun0" type: gre options: {remote_ip="192.168.56.12"} Port "sw1" Interface "sw1" type: internal Port "sw1-p1" Interface "sw1-p1" ovs_version: "2.5.90"
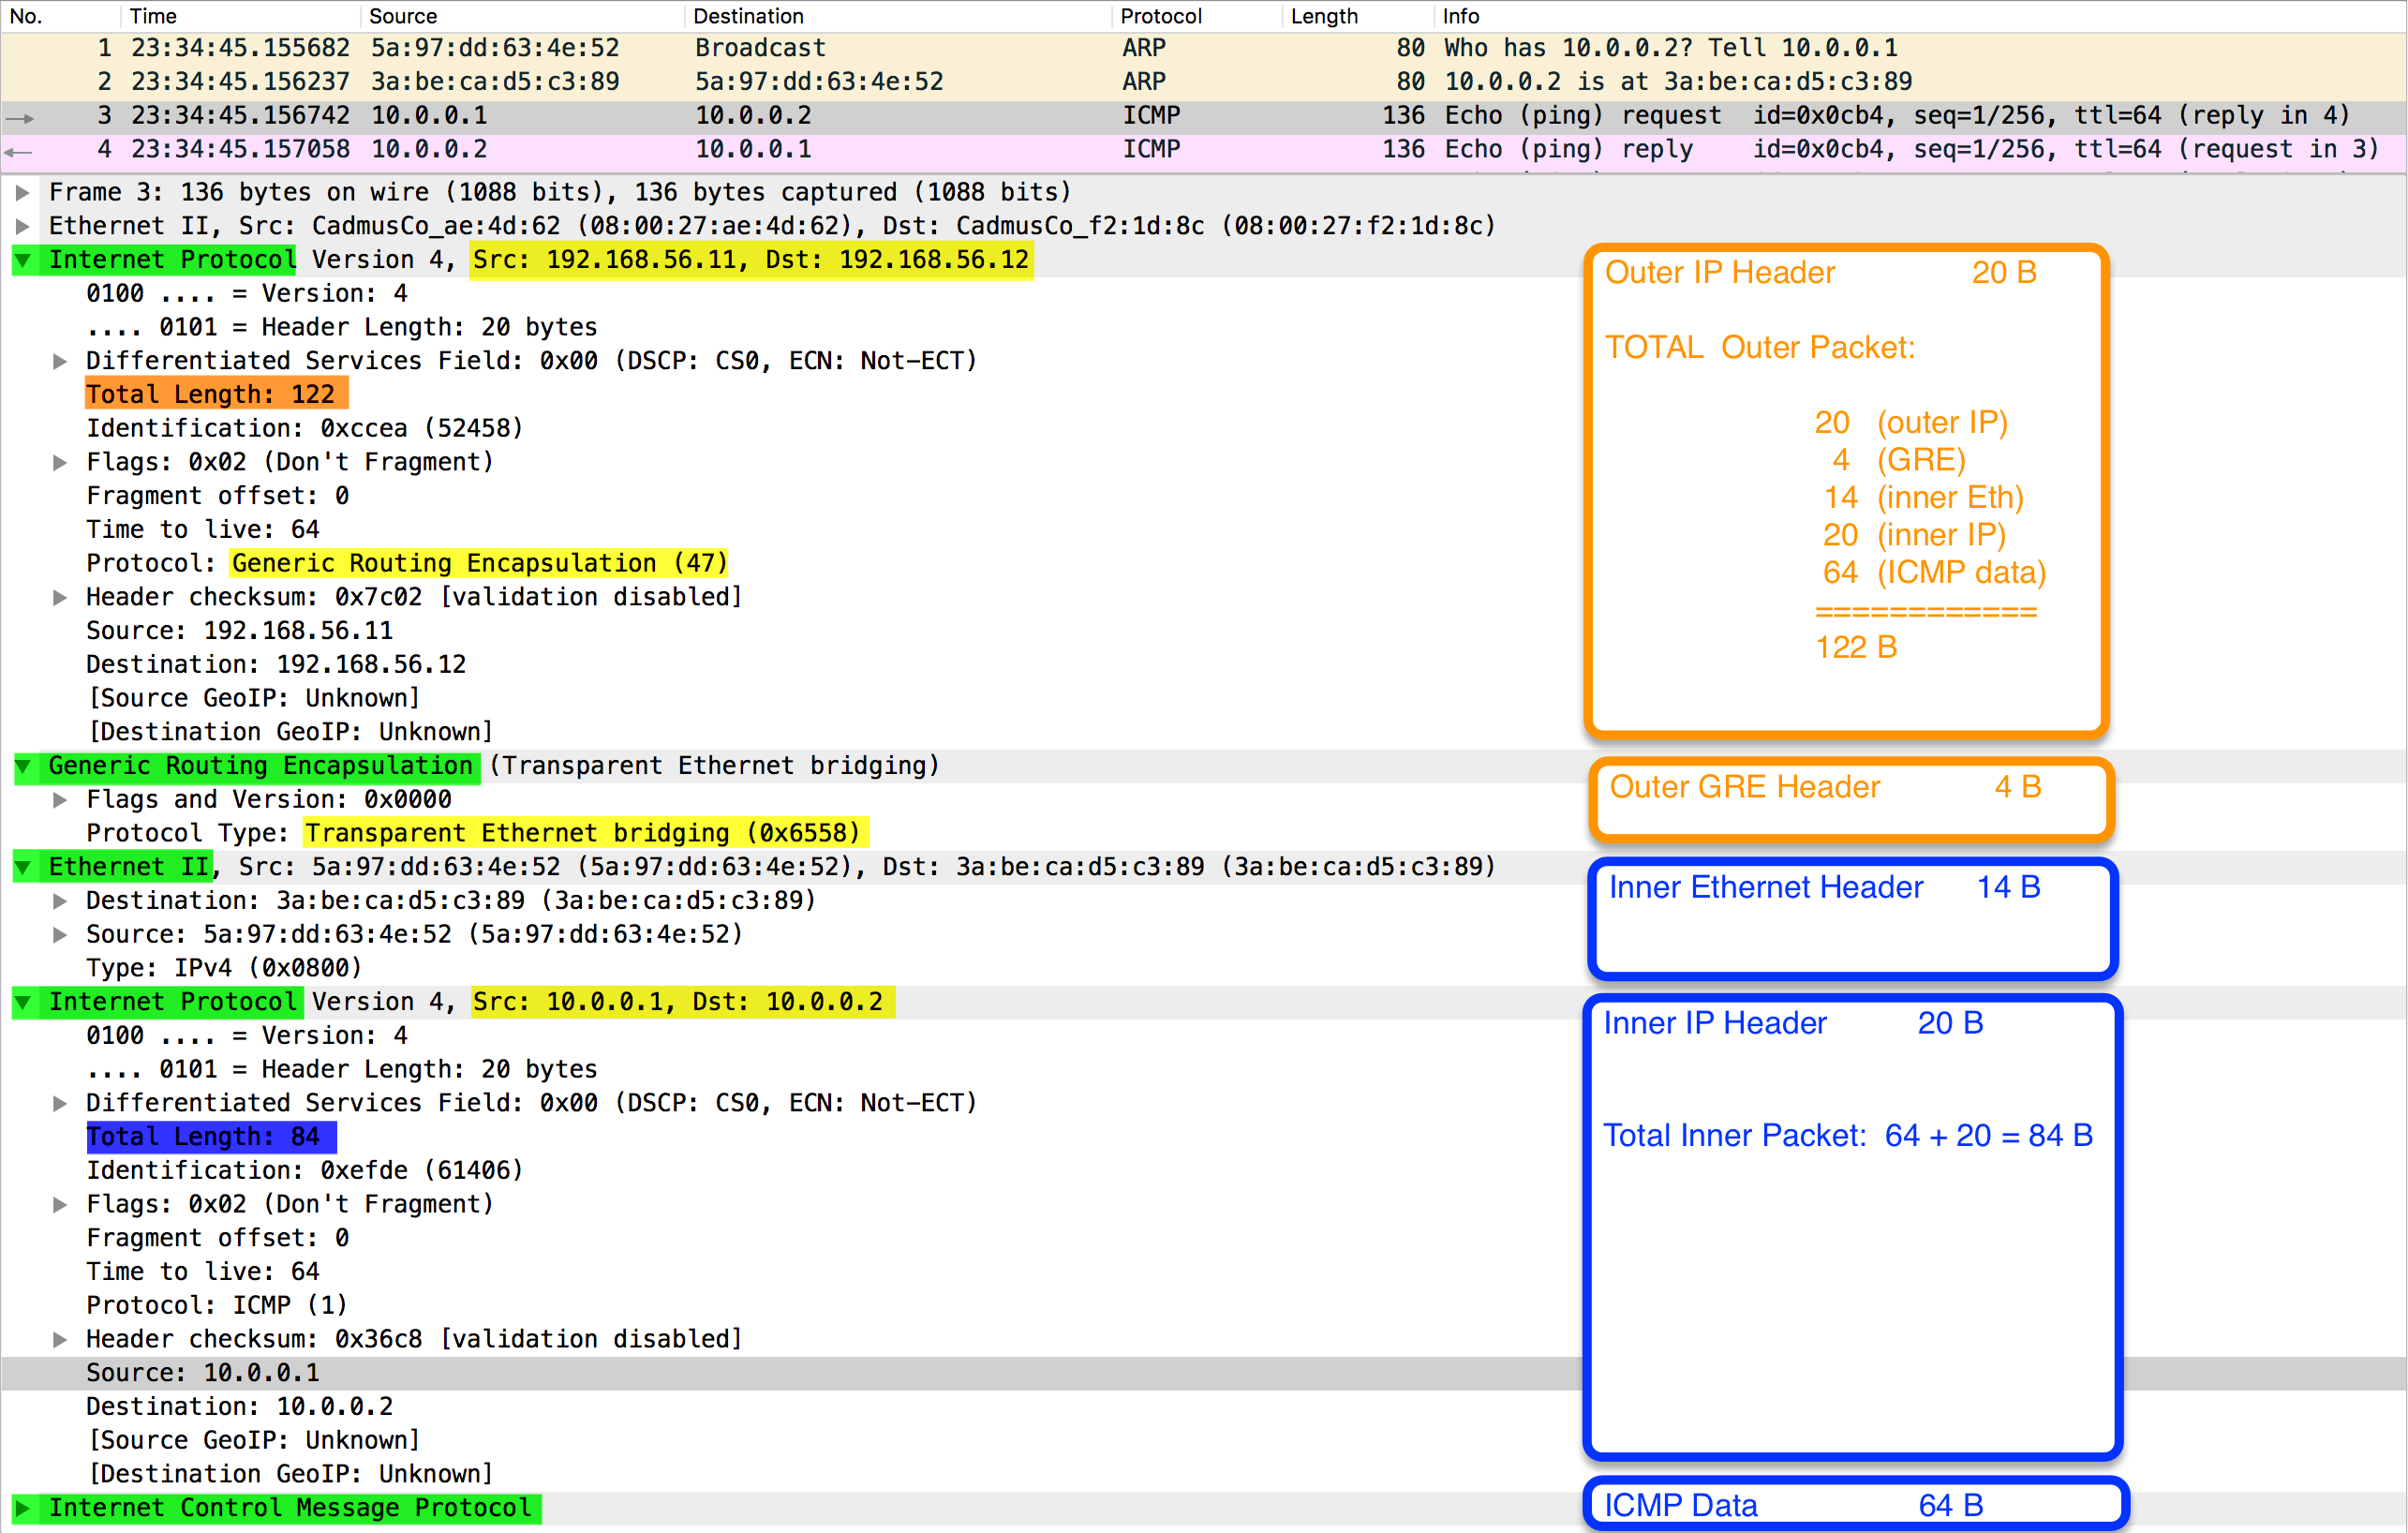
Since the GRETAP traffic is going via the physical enp0s8 interface, let's perform tcpdump on it and dissect it with wireshark - here you can view the entire packet capture:
You can notice that the initial Layer 2 frame (containing ICMP/IP - between 10.0.0.1 and 10.0.0.2) is entirely encapsulated into GRE/IP with external 192.168.56.11 and 192.168.56.12.
VXLAN
Before you continue, make sure that you delete the GRE interface created in the previous section:
sudo ovs-vsctl del-port tun0
The second tunneling protocol to be tested is VXLAN, a technique that encapsulates Layer 2 frames within Layer 4 UDP packets, using the destination UDP port 4789.
Using the same idea as above, with GRE, I will add a new port, of type vxlan, to the OVS bridge, specify the remote endpoint IP and an optional key.
# on vagrant box-1
# -----------------
sudo ovs-vsctl add-port sw1 tun0 -- set interface tun0 type=vxlan options:remote_ip=192.168.56.12 options:key=123

# on vagrant box-2
# -----------------
sudo ovs-vsctl add-port sw2 tun0 -- set interface tun0 type=vxlan options:remote_ip=192.168.56.11 options:key=123
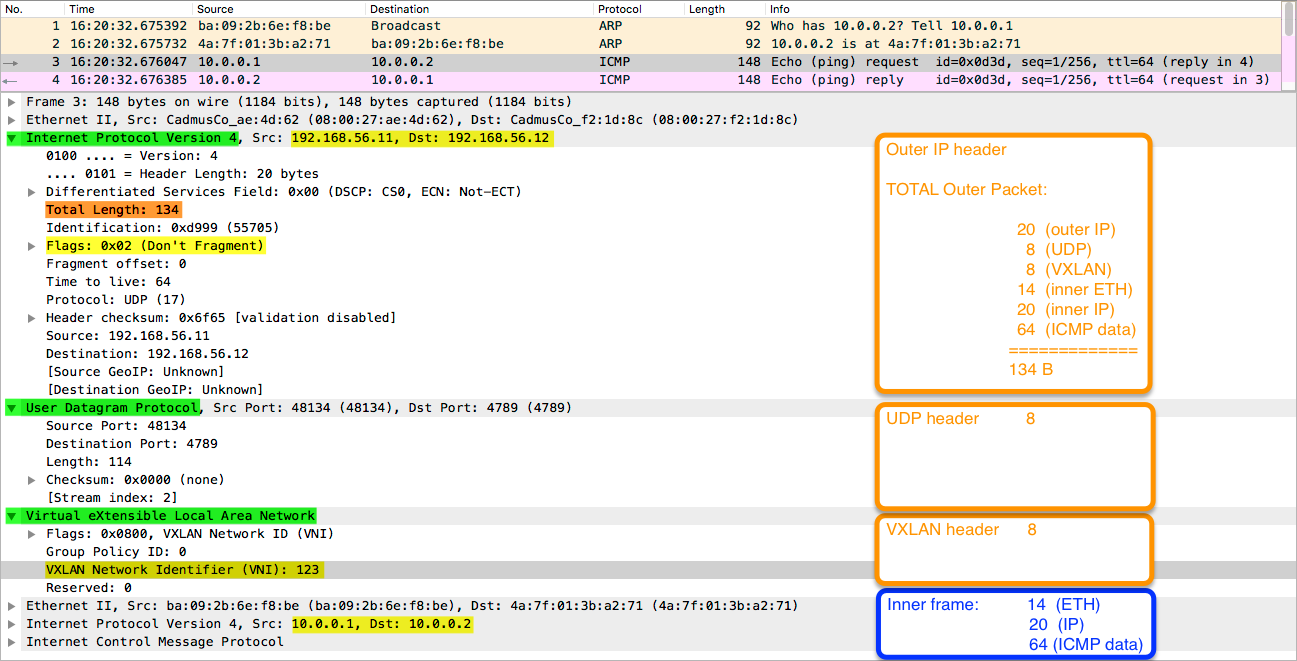
Here is how communication between internal VMs 10.0.0.1 and 10.0.0.2 looks like - now encapsulated in UDP 4789:
You can notice that the key=123 is used as VXLAN Network Identifier (VNI). You can view the entire packet capture here.
Geneve
If you followed this post, before testing Geneve, make sure you delete the previous VXLAN tunnel:
sudo ovs-vsctl del-port tun0
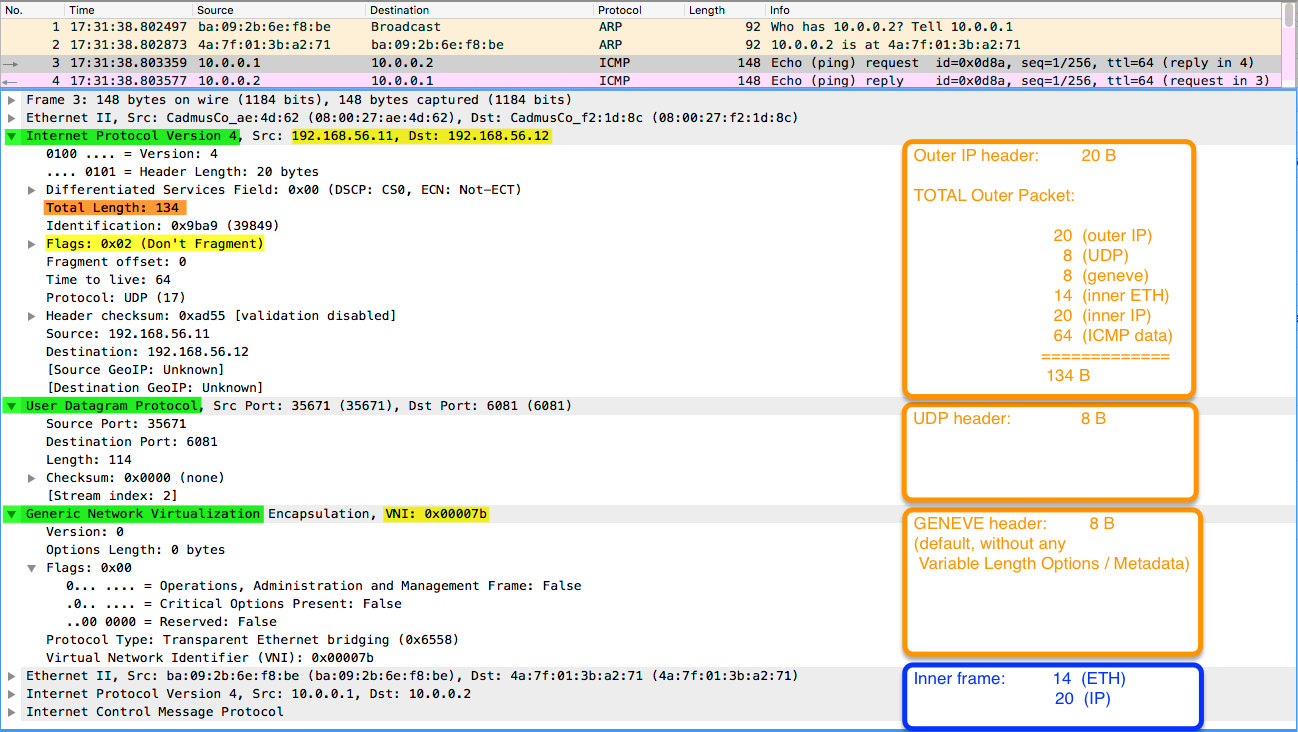
The next encapsulation to be presented is Geneve, a tunneling technique with a flexible format that allows metadata information to be carried inside Variable Length Options and provides service chaining (think firewall, load balancing, etc). Geneve header is more like an IPv6 header with basic fixed-length fields and extension headers used to enable different functions.
Let's have a look at its configuration and packet capture:
# on vagrant box-1
# -----------------
sudo ovs-vsctl add-port sw1 tun0 -- set interface tun0 type=geneve options:remote_ip=192.168.56.12 options:key=123

# on vagrant box-2
# -----------------
sudo ovs-vsctl add-port sw2 tun0 -- set interface tun0 type=geneve options:remote_ip=192.168.56.11 options:key=123
Here is the full packet capture - unfortunately, the CloudShark provider, where I store these captures, does not have a dissector for Geneve traffic, but Wireshark does (see image below):
GREoIPsec
Again, if you followed along, delete the previously created Geneve tunnel on both vagrant boxes:
ovs-vsctl del-port tun0
GREoIPsec does not need any introduction, so let's do the configuration. Note, though, that again here, the GRE payload is the Ethernet frame (same as with the GRETAP example presented above):
# on vagrant box-1 # ----------------- sudo ovs-vsctl add-port sw1 tun0 -- set interface tun0 type=ipsec_gre options:remote_ip=192.168.56.12 options:psk=test123 # on vagrant box-2 # ----------------- sudo ovs-vsctl add-port sw2 tun0 -- set interface tun0 type=ipsec_gre options:remote_ip=192.168.56.11 options:psk=test123 # test connectivity between 'left' and 'right' namespaces # notice the high times reported for the first pings # needed for the IPsec tunnel to get established ubuntu@box-1 ~$ sudo ip netns exec left ping 10.0.0.2 PING 10.0.0.2 (10.0.0.2) 56(84) bytes of data. 64 bytes from 10.0.0.2: icmp_seq=1 ttl=64time=2000 ms 64 bytes from 10.0.0.2: icmp_seq=2 ttl=64time=1001 ms 64 bytes from 10.0.0.2: icmp_seq=3 ttl=64 time=2.14 ms 64 bytes from 10.0.0.2: icmp_seq=4 ttl=64 time=0.793 ms ...
If you are curious how this works: OVS uses racoon package to build and manage the IPsec tunnel. Have a look at racoon config files /etc/racoon/racoon.conf and /etc/racoon/psk.txt - you will notice that the configuration is automatically generated by Open vSwitch.
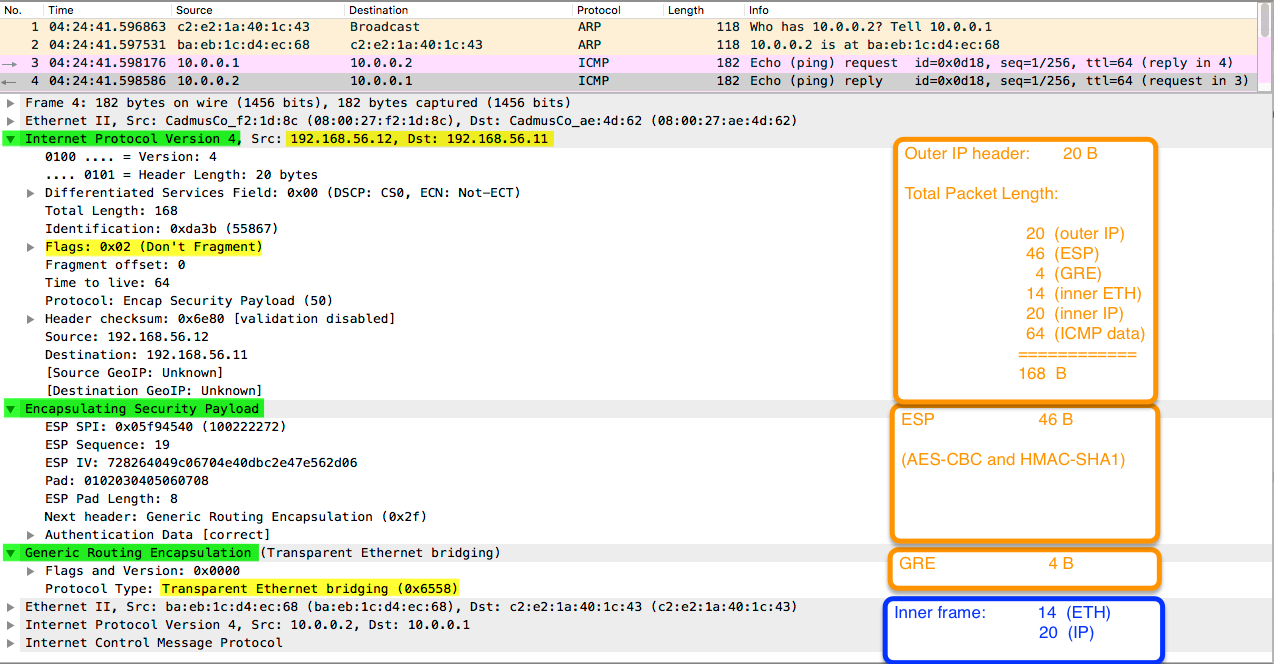
Here is the full packet capture, but of course, as it's IPsec, you will only see the outer IP header (192.168.56.11 and 192.168.56.12), while the payload (GRE/ETH/IP/ICMP) is encrypted and you only see ESP information.
But if you use Wireshark, you can provide the keys and it will decrypt it for you - see below:
If you are curious, how Wireshark decrypted it, I will present that in a separate blog post !
Since this post became very long, I decided to leave the iperf tests for a separate article, also because you will have to deal with MTU issues and TCP Segmentation Offload (tso) - it will be better to explain all of that in a separate post!
Thanks for your interest ! Stay tuned for the follow-up articles on this topic !

 Costi is a network and security engineer with over 10 years of experience in multi-vendor environments. He holds a CCIE Routing and Switching certification and is currently pursuing same expert-level certifications in other areas. He believes that the best way to learn and understand networking topics is to challenge yourself to fix different problems, production-wise or lab-type exams. He also enjoys teaching networking and security technologies, whevever there is an opportunity for it.

Comments
comments powered by Disqus